
I was fortunate to gain access to the archives of St Finan’s Hospital for my Masters research. There are hundreds of archival books covering the admissions of patients to the Killarney hospital since 1852. It was a privilege to gain access to the records which have been documented and filed for nearly 160 years. These files have the potential to tell the stories of thousands of people from County Kerry and beyond who spent some of their lives in the hospital. My first approach to the research was to investigate the admission books. Initially the admission books were quite basic but from the mid 1890s, they started holding a wealth of socio-demographic details about the patients of the Killarney asylum. This article focuses on a particular time period from 1900 to 1930 and the research discoveries resulted in quite a wide range of themes and issues related to mental health and the patients. Instead of writing loads of text, this article is going to use data visualizations to look at the trends and patterns from the data. Some of the visualisations are interactive, which means that if you click on section e.g years or occupation, you will see the values for that.
Figure 1: The Archives from St Finan’s Hospital

The admission books from 1900 to 1930 maintain a consistency in logging key traits. For instance, all maintain a log of admission dates and death/discharge, as well as name, admission number, whose authority to admit, medical officer, diagnosis, cause, bodily health, age, gender, marital status, occupation and origin. Up to 1903 education levels were logged sporadically in the observation column. In 1905 and 1910, no education was logged but thereafter, education level had a distinct column and was consistently logged. Contributory Offences aligned to the patients’ admissions, had a distinct column in the late 1800s, and were logged in the 1900 admission book, but was discontinued from 1902 onwards. In 1905, there was a specific column for epileptics and another for idiots, which were omitted from the later admission books. The Admission book name changed from Killarney Lunatic Asylum, to Killarney District Lunatic Asylum to Killarney District Asylum to Killarney Mental Hospital over the thirty years. It later changed to St Finan’s Hospital. Overall, there are rarely omissions and the admission books are chronologically indexed with identifying patient numbers and easy to navigate.
Figure 2
Figure 3
Throughout Ireland, asylum numbers were increasing since the 18th century. There were over 25,000 confined in an institute for insanity in 1915. The chart below also gives an comparison of KDLA and national figures for 1915.While public asylums were the dominant institute for the care of individuals with mental health problems, workhouses, private asylums, prisons and Dundrum the centre for the criminal insane in Dublin, all had facilities for the insane.
Figure 4
https://datawrapper.dwcdn.net/OGJuI/1/
Figure 5 represents the 1920 figure represents the KDLA patients who were admitted in 1920 and their subsequent length of time in KDLA. The black bars indicate those who died and red, those who were discharged. The interactive chart will give the values when clicked on. The longest stay was for 45.4 years resulting in the patient’s death in the asylum. The longest stay for a patient who was subsequently released was 43.6 years. The admission registers records whether, at discharge, patients had ‘recovered’, were ‘relieved’, had ‘not improved’ or had died. The trustworthiness of the admission data in relation to discharge/death appears dependable and can be cross-referenced with at least two other archival sources. While a considerable number of admissions lasted only a few weeks or months, the average length of stay was 5.2 years.
Figure 5
https://datawrapper.dwcdn.net/vQXS0/2/
Figure 6
To give another perspective, the data was used to calculated the number of patients who died or were or discharged infographic, and the number who were deemed to have recovered or relieved, covering 1900, 1915, 1930 (Figure 6). The cause of the patients is not in admissions, only casebooks and death and discharge book. Its interesting to note that in 1900, there was a smaller number discharged than 1915 and 1930. Overall, discharges are marginally higher than deaths in the hospital. The inforgraphs below also gives a visual overview of the health status of patients on arrival to KDLA, as well as, the age groups admitted over the first three decades of the 20th century.
County Kerry was a rural community with the majority of the population made up of small tenant farmers, Income was low and there was frequent food insecurity. The majority of patients admitted were labourers. In those days, both male and females may have worked as labourers and that is represented in the collected data, however, the vast majority were males. A very close second are individuals from the farming environment, whether owner of a farm, family member or worker. Servants, including domestics, caretakers and general unskilled service staff, were the third highest throughout the first three decades of the 20th century.
Figure 8 uses the same data but clearly demonstrates the top three occupations, though is not as clear about the minor profession such as draper and housekeeper.
Figure 7
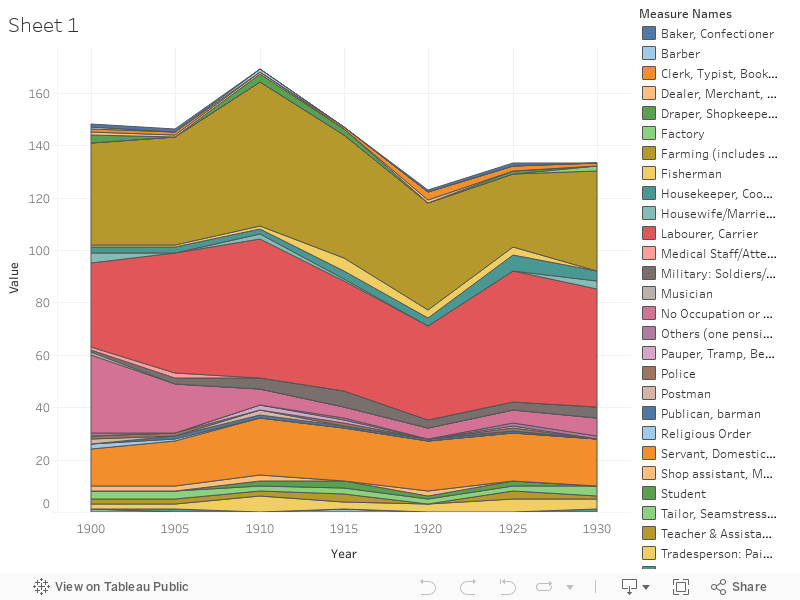
Figure 8 is a simple visual that charts the actual patient numbers that pass through St Finan’s Hosptial. Obviously the number is going to increase but St Finans, like the rest of the asylums in Ireland expanded at an enormous rate.
Figure 8
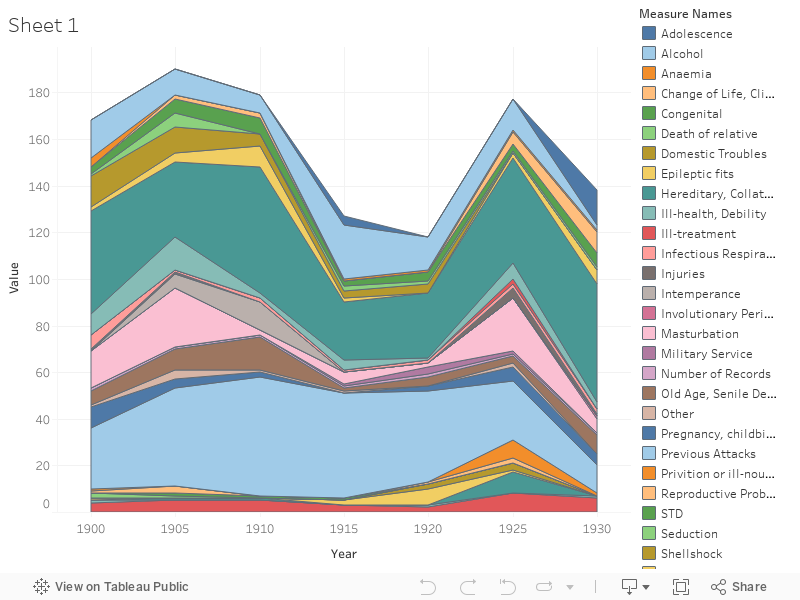
Admission records from the early 1900s give a synopsis of the perceived contributory or underlying causes to the medical diagnosis.
Figure 2
Education levels in the KLDA were compared over three decades using a pie chart. Findings indicated that most patients admitted over the first three decades of the twentieth century could read and write to some degree. In 1900, 80% and this grew to 87% by 1930. However, in 1900, 17% were literate, this decreased significantly to 6% in 1930.
https://datawrapper.dwcdn.net/tcDkZ/1/

When calculating the district sub-area that the patients came from it was noted that the Killarney area represented the highest group. This data was only collected and collated for 1910.
Though rarely logged in the admission book after the 1900s, it was noted that from the sample case studies, that harm to self or injury to self or attempted suicide was a significant causative factor. Another final finding in relation to the socio-demographic is that the atypical profile (2 in 5) to be admitted to the asylum was male, under forty, working as a labourer with family history of insanity (Figure 18). Additionally, it could be summarised that they would live nearer to the asylum than other groups, displayed evidence of a basic education and was a Roman Catholic. Finally, one in seven females had reproductive issues listed as a cause.